Back
3 Feb 2020
USD/INR New York Price Forecast: Greenback advance limited by 71.60 resistance vs. rupee
- USD/INR’s bear flag could limit the upside.
- The level to beat for buyers is the 72.00 figure.
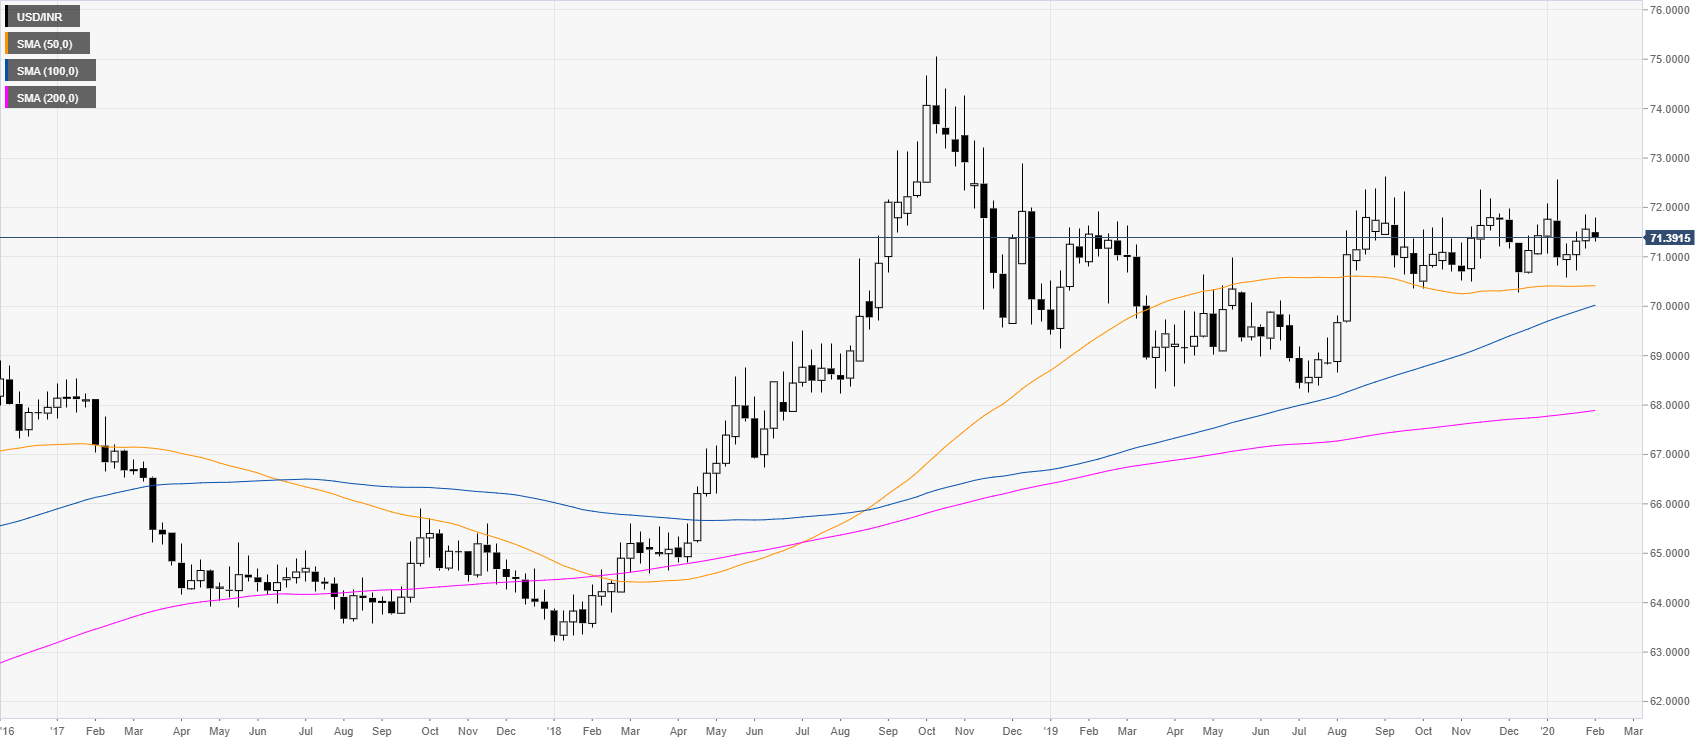
USD/INR weekly chart
After the bull market of 2018, USD/INR has been consolidating in a rectangle formation. The market is trading above the main weekly simple moving averages (SMAs).
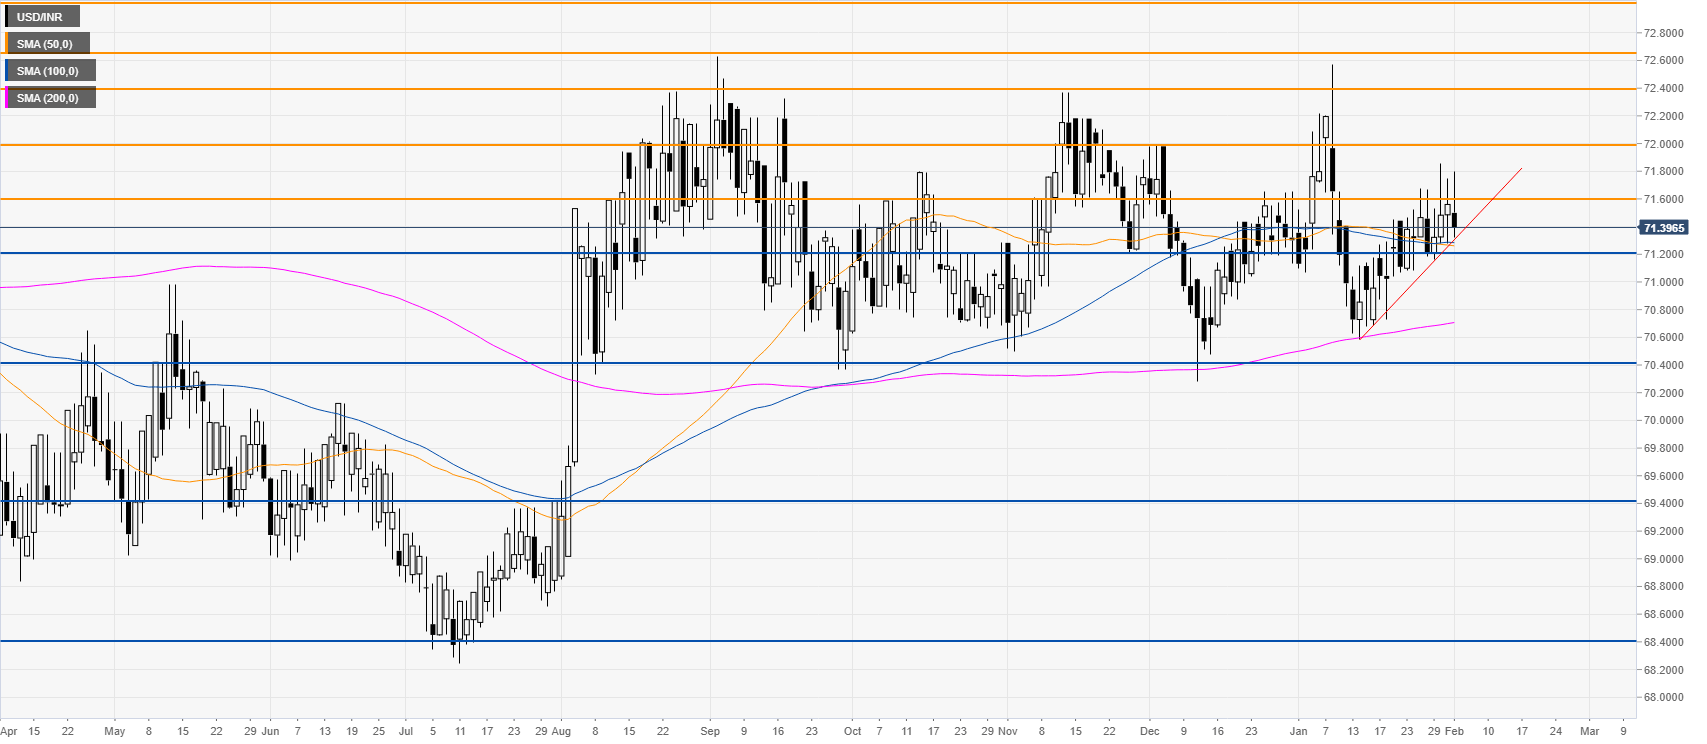
USD/INR daily chart
The spot created a bear flag within a rectangle formation as the bulls had multiple attempts to breach the 7.160 resistance. However, the market is set to remain sideways to bullish as long is it holds above the 71.20 support. Below this level bears could be looking for a potential drop to the 70.40 support. On the flip side, a break above the 72.00 figure could open the doors to 72.40 resistance.
Additional key levels