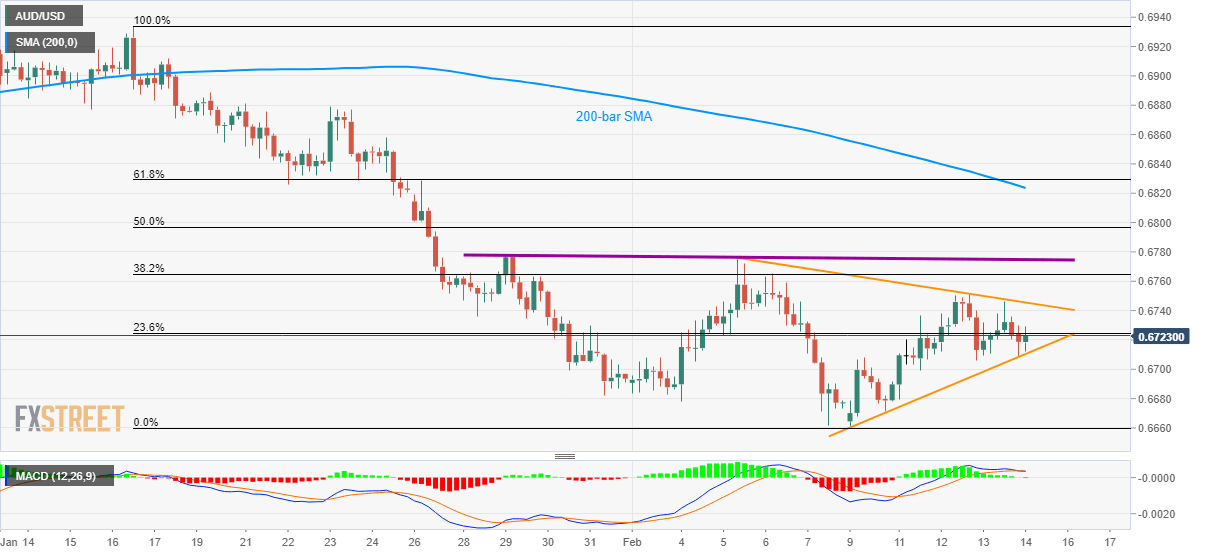
AUD/USD Price Analysis: Stuck in a symmetrical triangle below 200-bar SMA
- AUD/USD clings to 23.6% Fibonacci retracement.
- Two-week-old horizontal resistance adds to the upside barriers.
- Sustained trading below key resistances, MACD teasing bears favor the pair’s declines.
AUD/USD seesaws around 0.6725 during the Asian session on Friday. The pair has been moving inside a short-term symmetrical triangle while also staying below short-term key resistances. Also supporting the bears are MACD conditions that could inch to signaling further declines.
However, sellers will refrain from entry unless AUD/USD prices dip below 0.6710, the formation support. In doing so, 0.6680 and the monthly bottom around 0.6660 will be on their radars.
If at all prices keep trading below the decade low, early-February 2009 tops near 0.6550 could please the sellers.
Alternatively, an upside clearance of the symmetrical triangle resistance, at 0.6745, will trigger the pair’s run-up to highs marked on January 29 and February 5, near 0.6775/80.
Should there be a further north-run by the pair beyond 0.6780, 200-bar SMA close to 0.6825 will become the buyers’ favorite.
AUD/USD four-hour chart
Trend: Sideways